🔋 Singularity Map / Build your energy community Web Based (B2B/B2C)
Grid Singularity is transforming energy usage through an innovative energy exchange market powered by blockchain technology. By facilitating peer-to-peer energy trading among citizens, companies, and NGOs, it aims to democratize energy consumption from households to industrial levels, promoting renewable sources like solar panels and wind turbines.
Grid Singularity envisions a sustainable, inclusive, and democratic energy market, empowering individuals and communities to make informed energy decisions.
My Role
As the Product Designer, I played a central role in the design and development of the Singularity Map. My responsibilities included:
- Leading the design process alongside the Design Lead.
- Conducting workshops to identify pain points and opportunities for improvement.
- Brainstorming and defining the MVP1 scope.
- Creating pixel-perfect designs and ensuring alignment with developers.
- Gathering and incorporating user feedback post-launch to enhance the product.

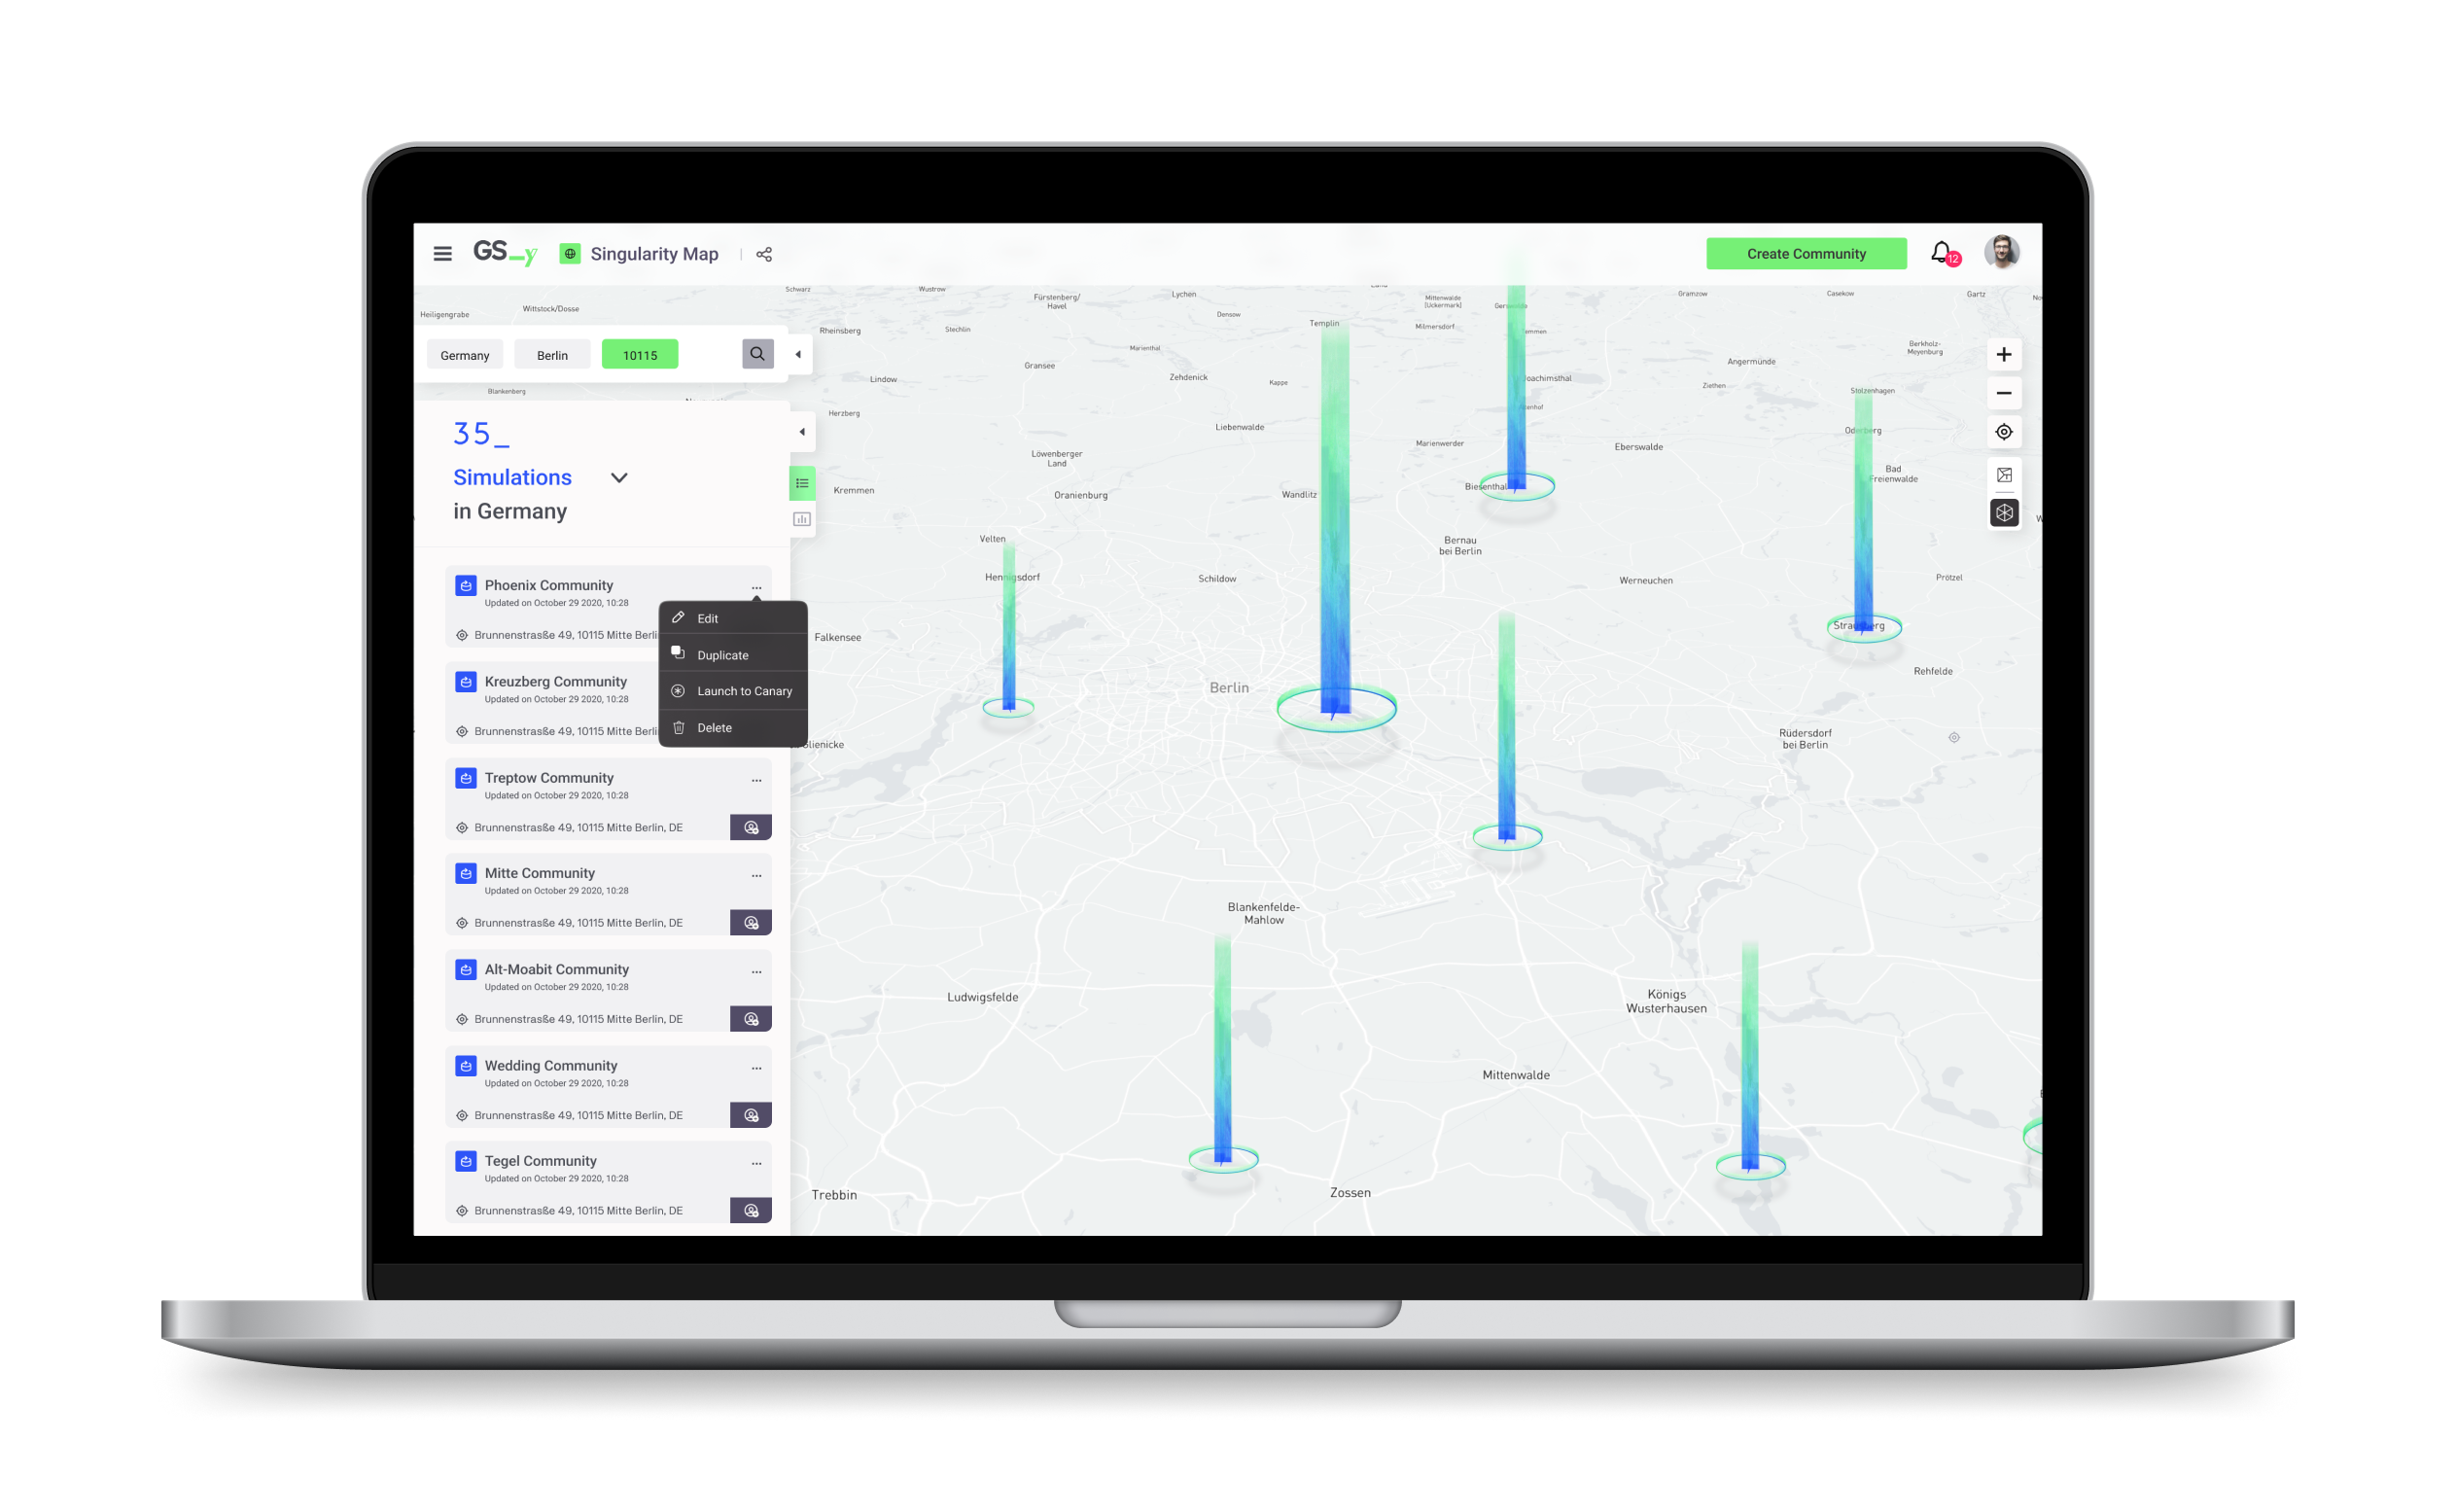
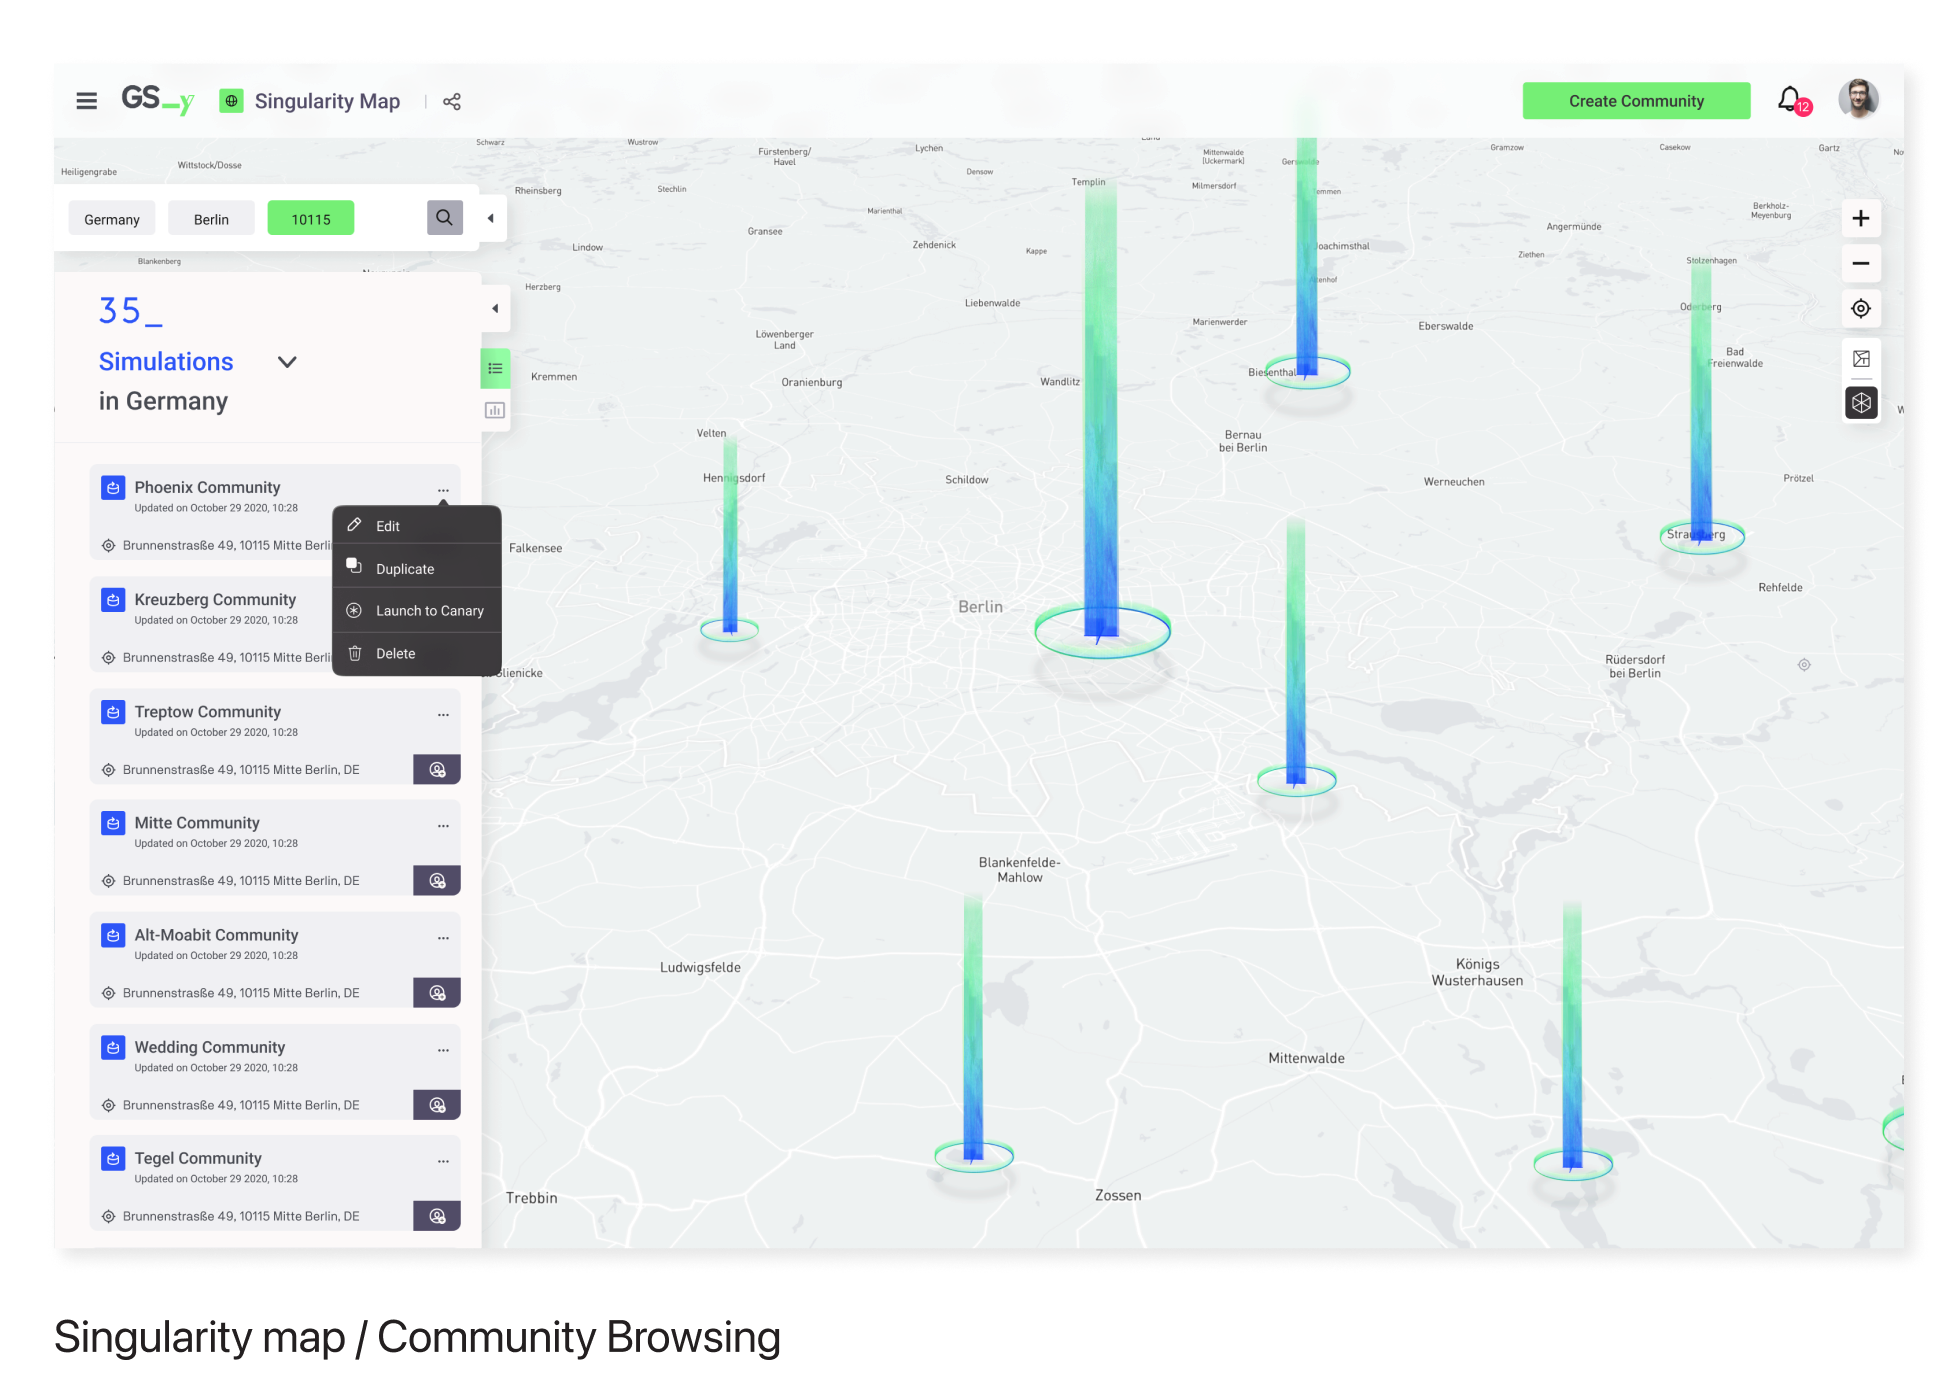
Singularity Map
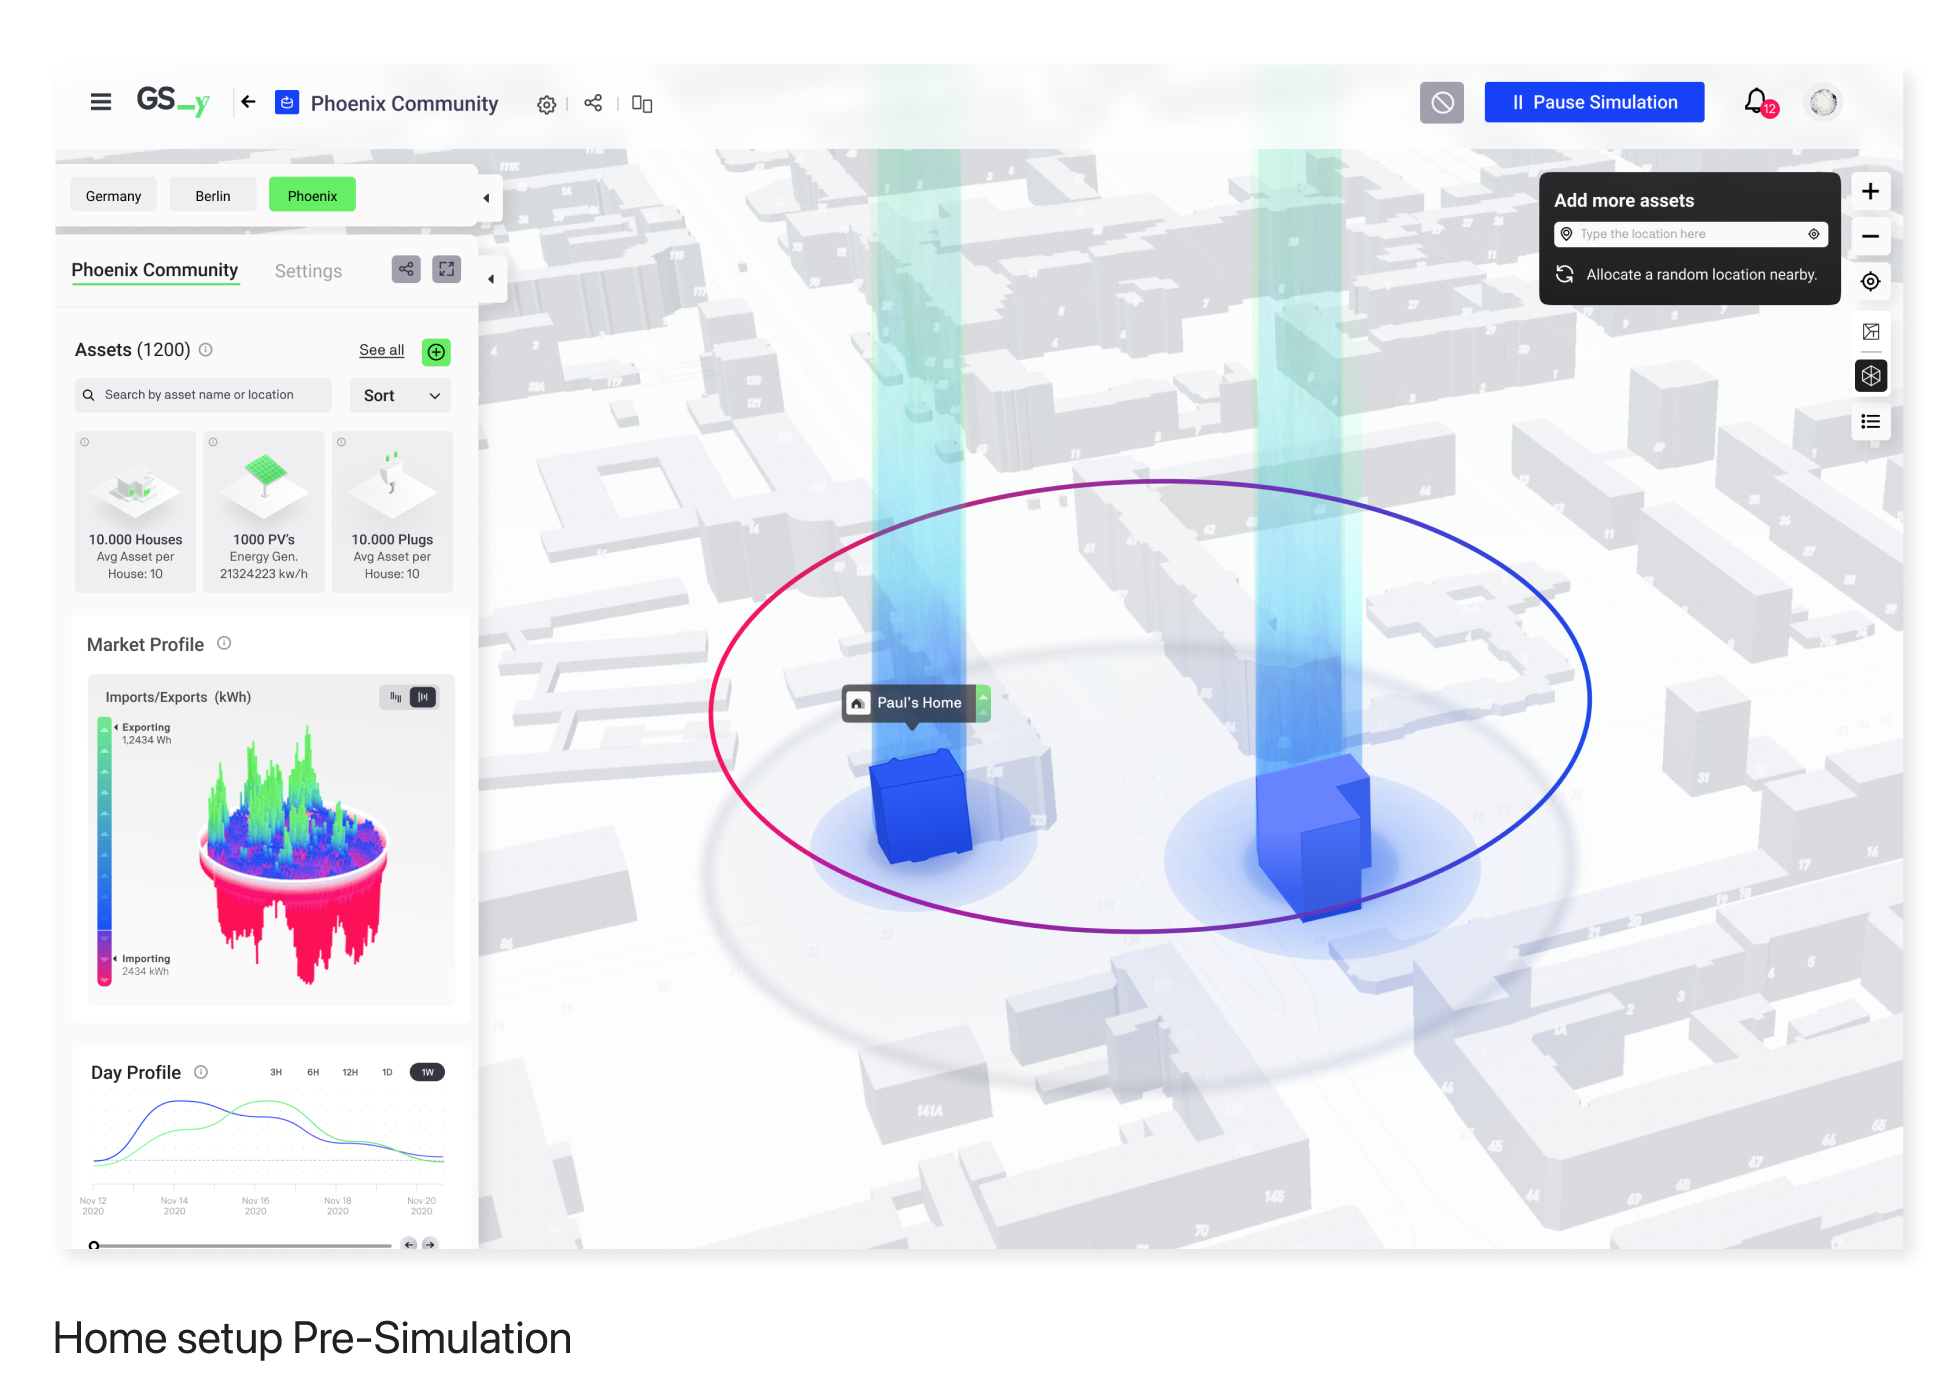
We developed and launched the Singularity Map, an interactive tool enabling users to create and simulate community energy setups. This allows users to understand consumption patterns and make informed decisions on energy trading and hardware upgrades.
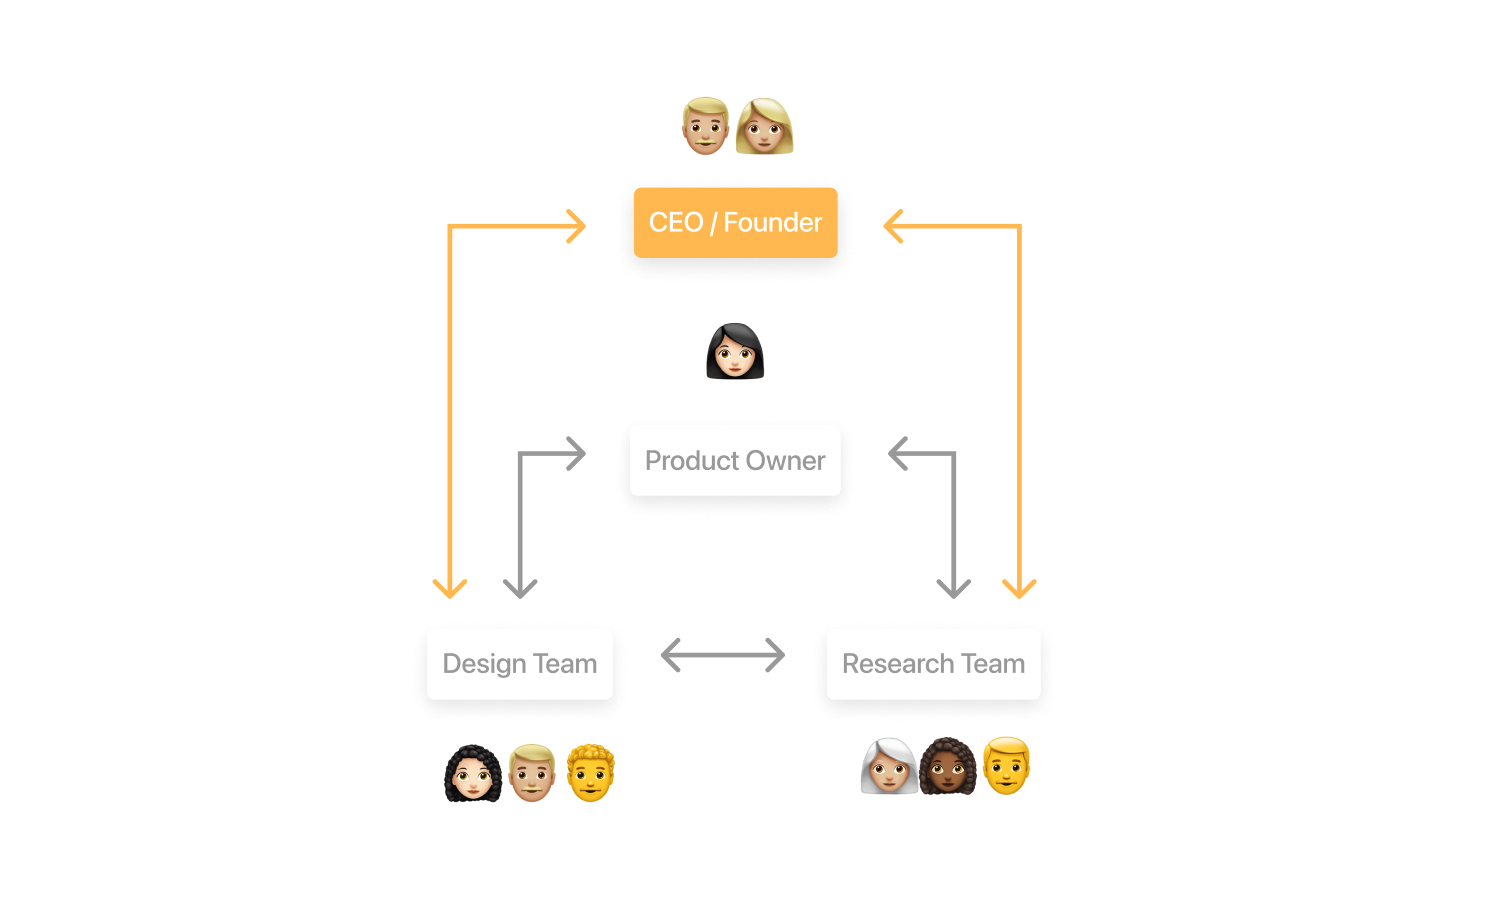
Team Setup
Our team comprised a Lead Designer, myself as the Product Designer, and a Junior Designer. We maintained autonomy while ensuring continuous communication with the CEO and Product Owner (PO). This collaborative approach ensured our design decisions aligned with business objectives.
Project Timeline
Step 1: Understanding Workshop with PO and CEO We conducted a one-week workshop to analyze the previous UI and identify pain points, essential for a successful product relaunch. (1 week)
Step 2: Brainstorming Solutions for Product Enhancement Inspired by Google Maps' simplicity, we brainstormed solutions to create an engaging interface for interacting with energy communities. (1 week)
Step 3: Design Redefinition We defined the MVP1 scope and began designing the product, incorporating contemporary UI trends. (3 months)
Step 4: Design Delivery Package. We prepared pixel-perfect designs, documented them on Figma, aligned with developers, and made necessary adjustments based on their feedback. (1 month)
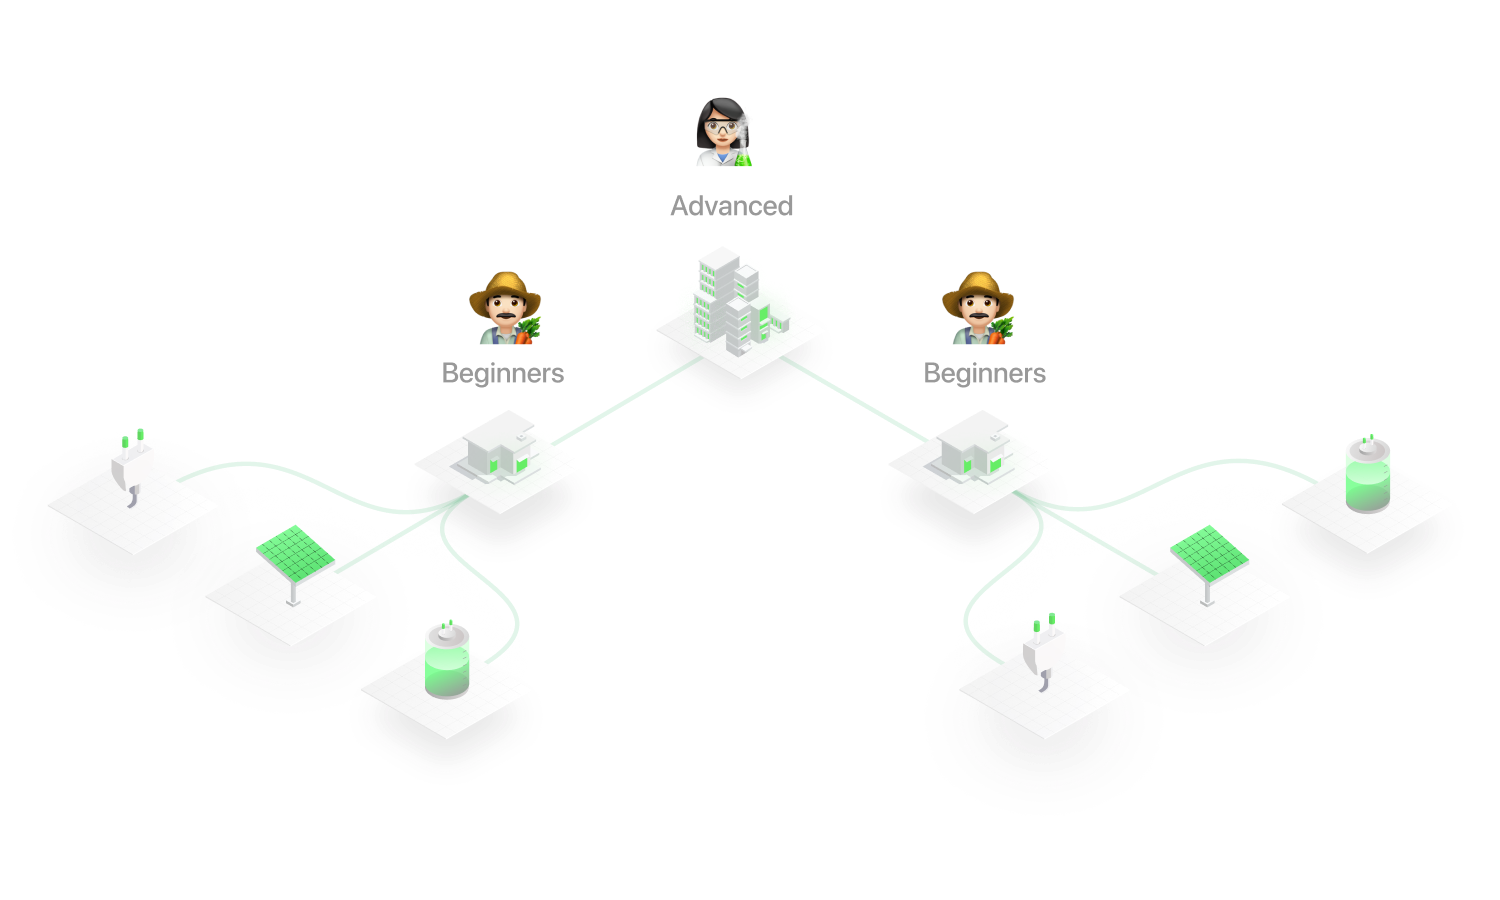
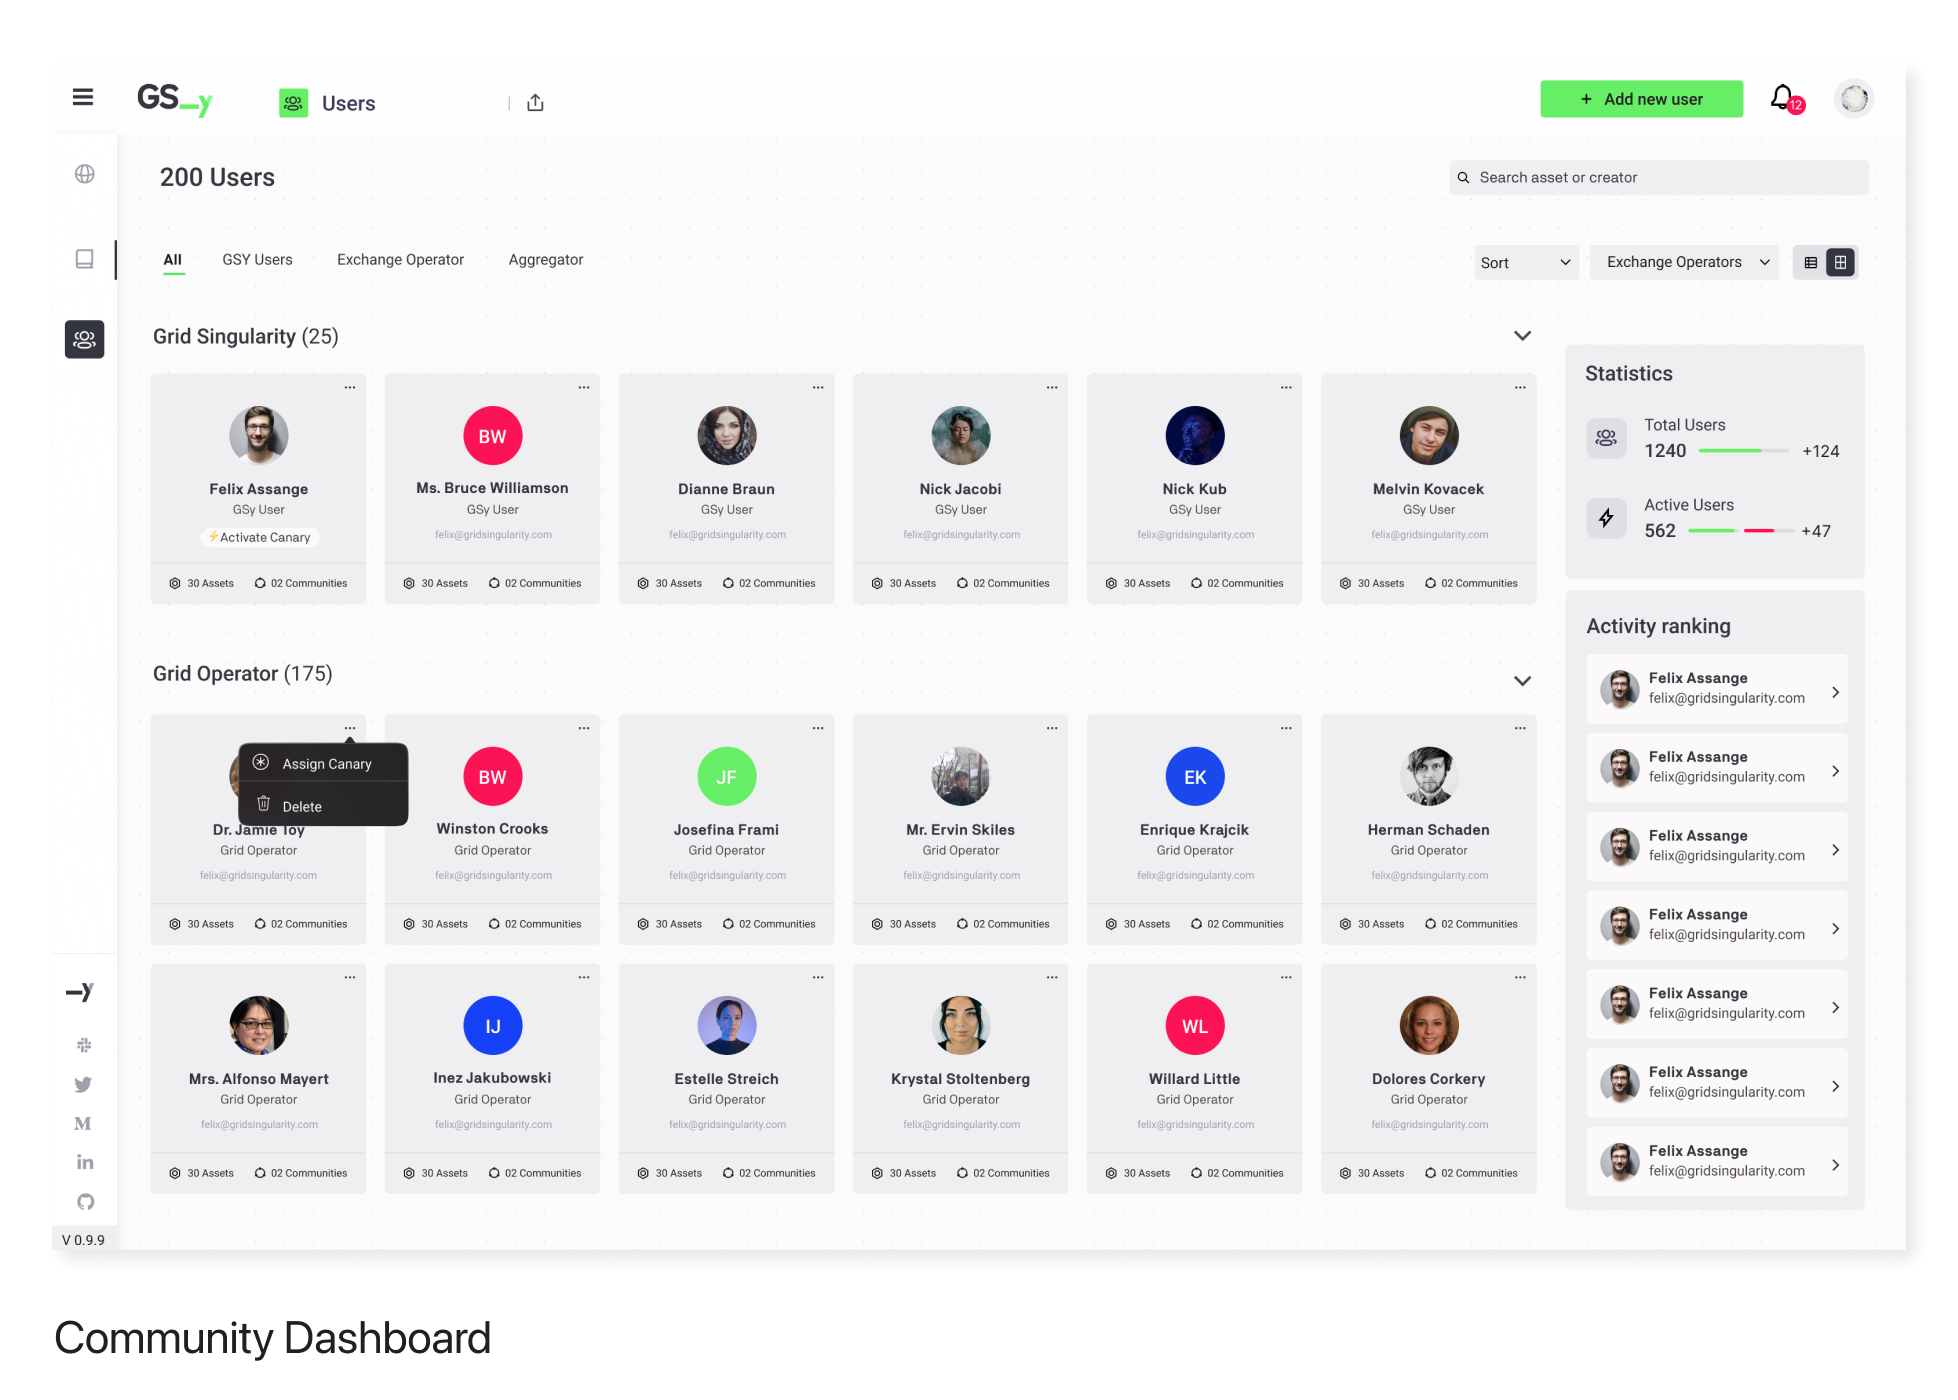
Users
We identified two primary user groups with distinct needs:
Beginners (Household owners, farmers, small business owners)
- Set up houses within designated communities
- Trade energy with neighbors
- Understand energy consumption
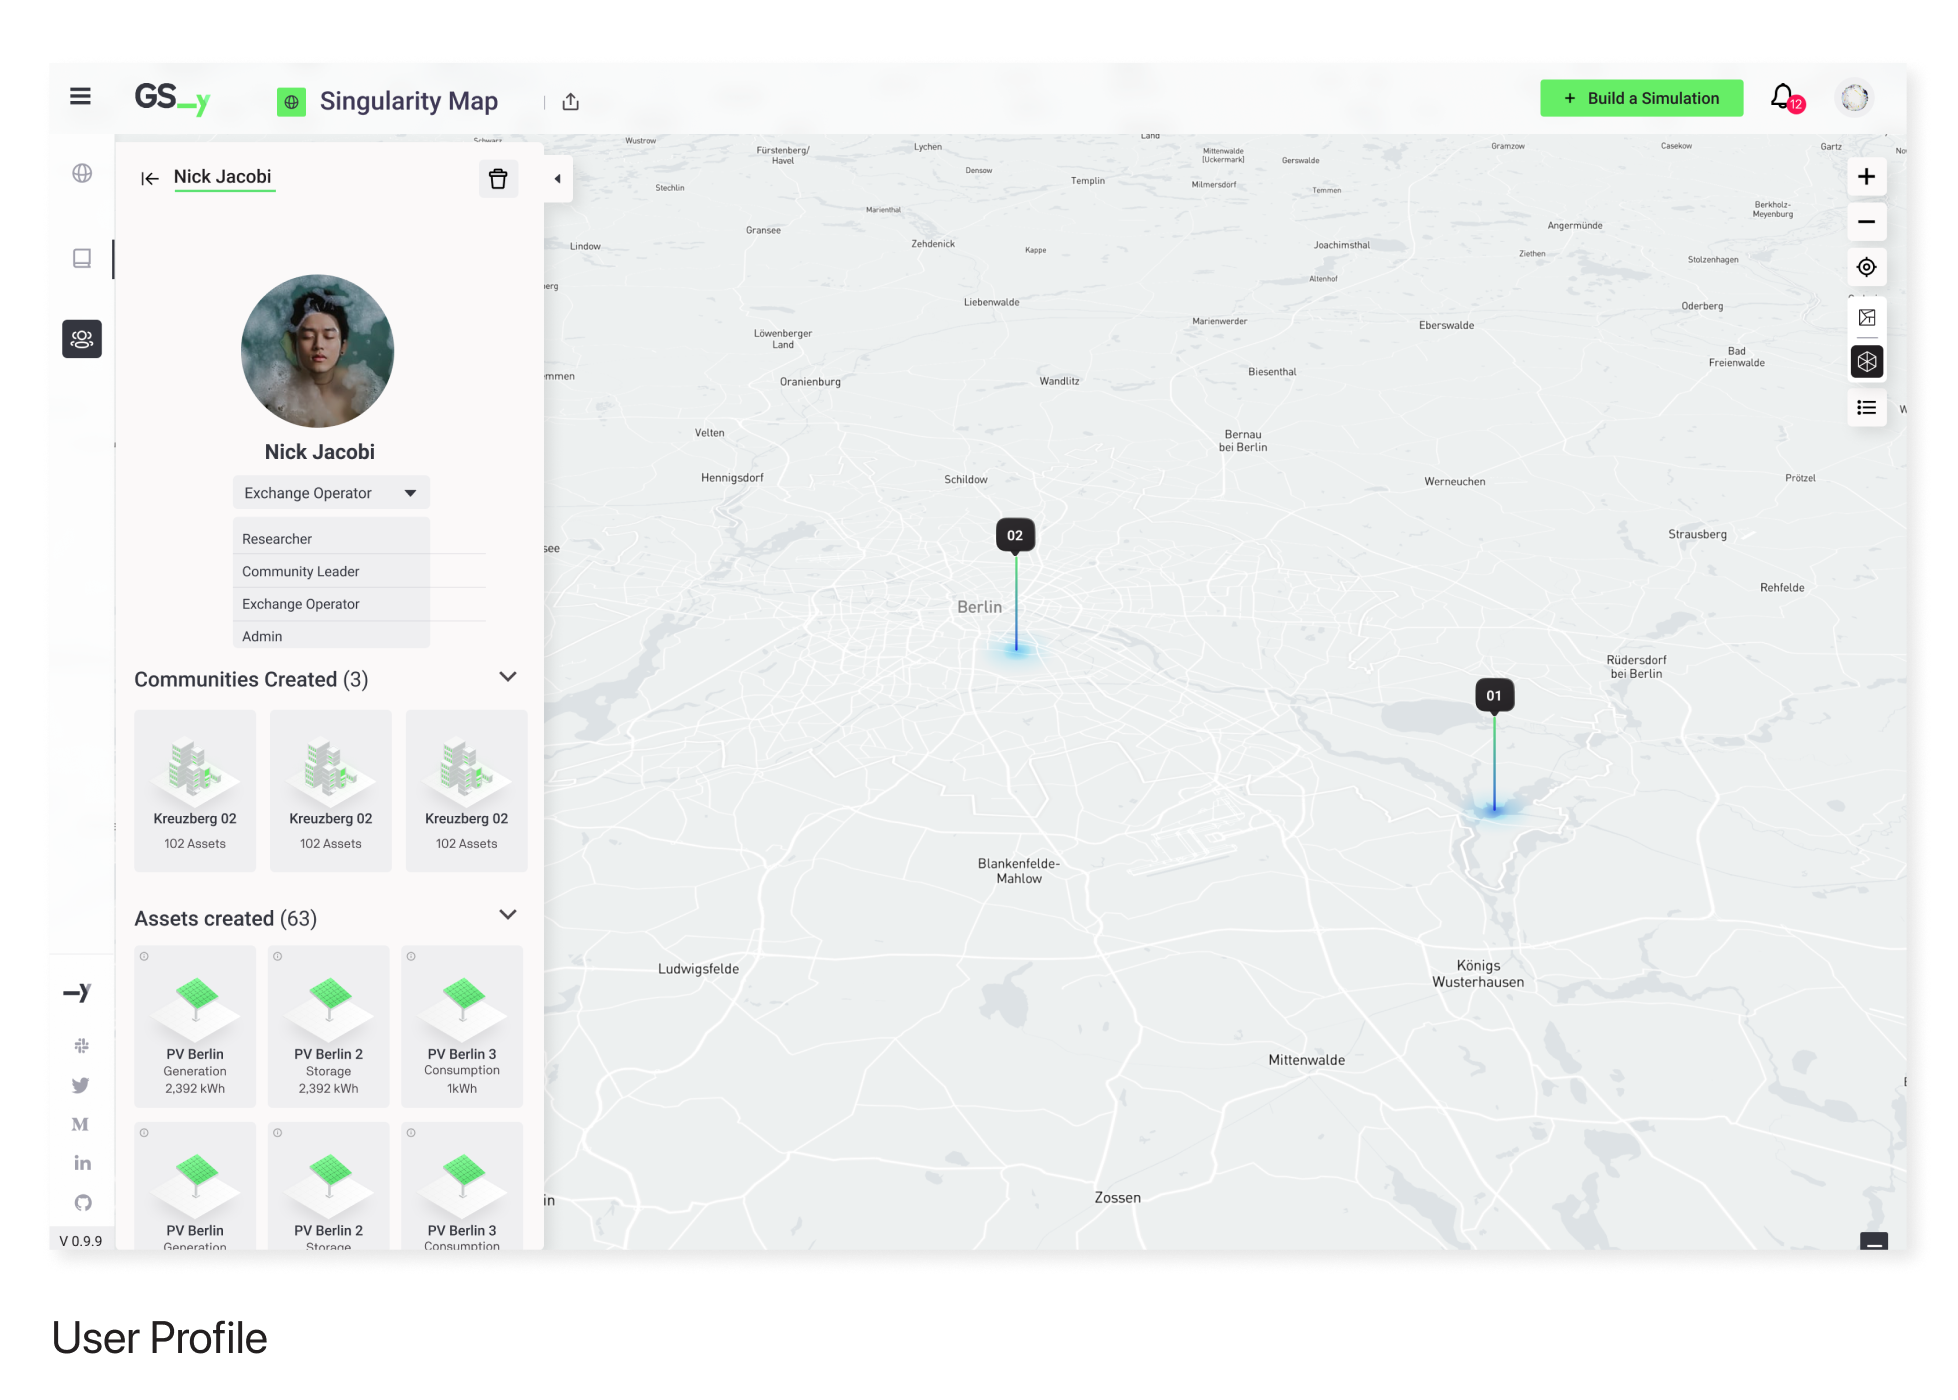
Advanced Users (University researchers, community leaders, hardware providers)
- Establish local energy markets by searching nearby communities
- Create and manage communities
- Utilize simulation results for research
- Sell excess energy
- Purchase energy from other communities
- Understand energy behavior to upgrade assets (e.g., install new solar panels)
Design Process
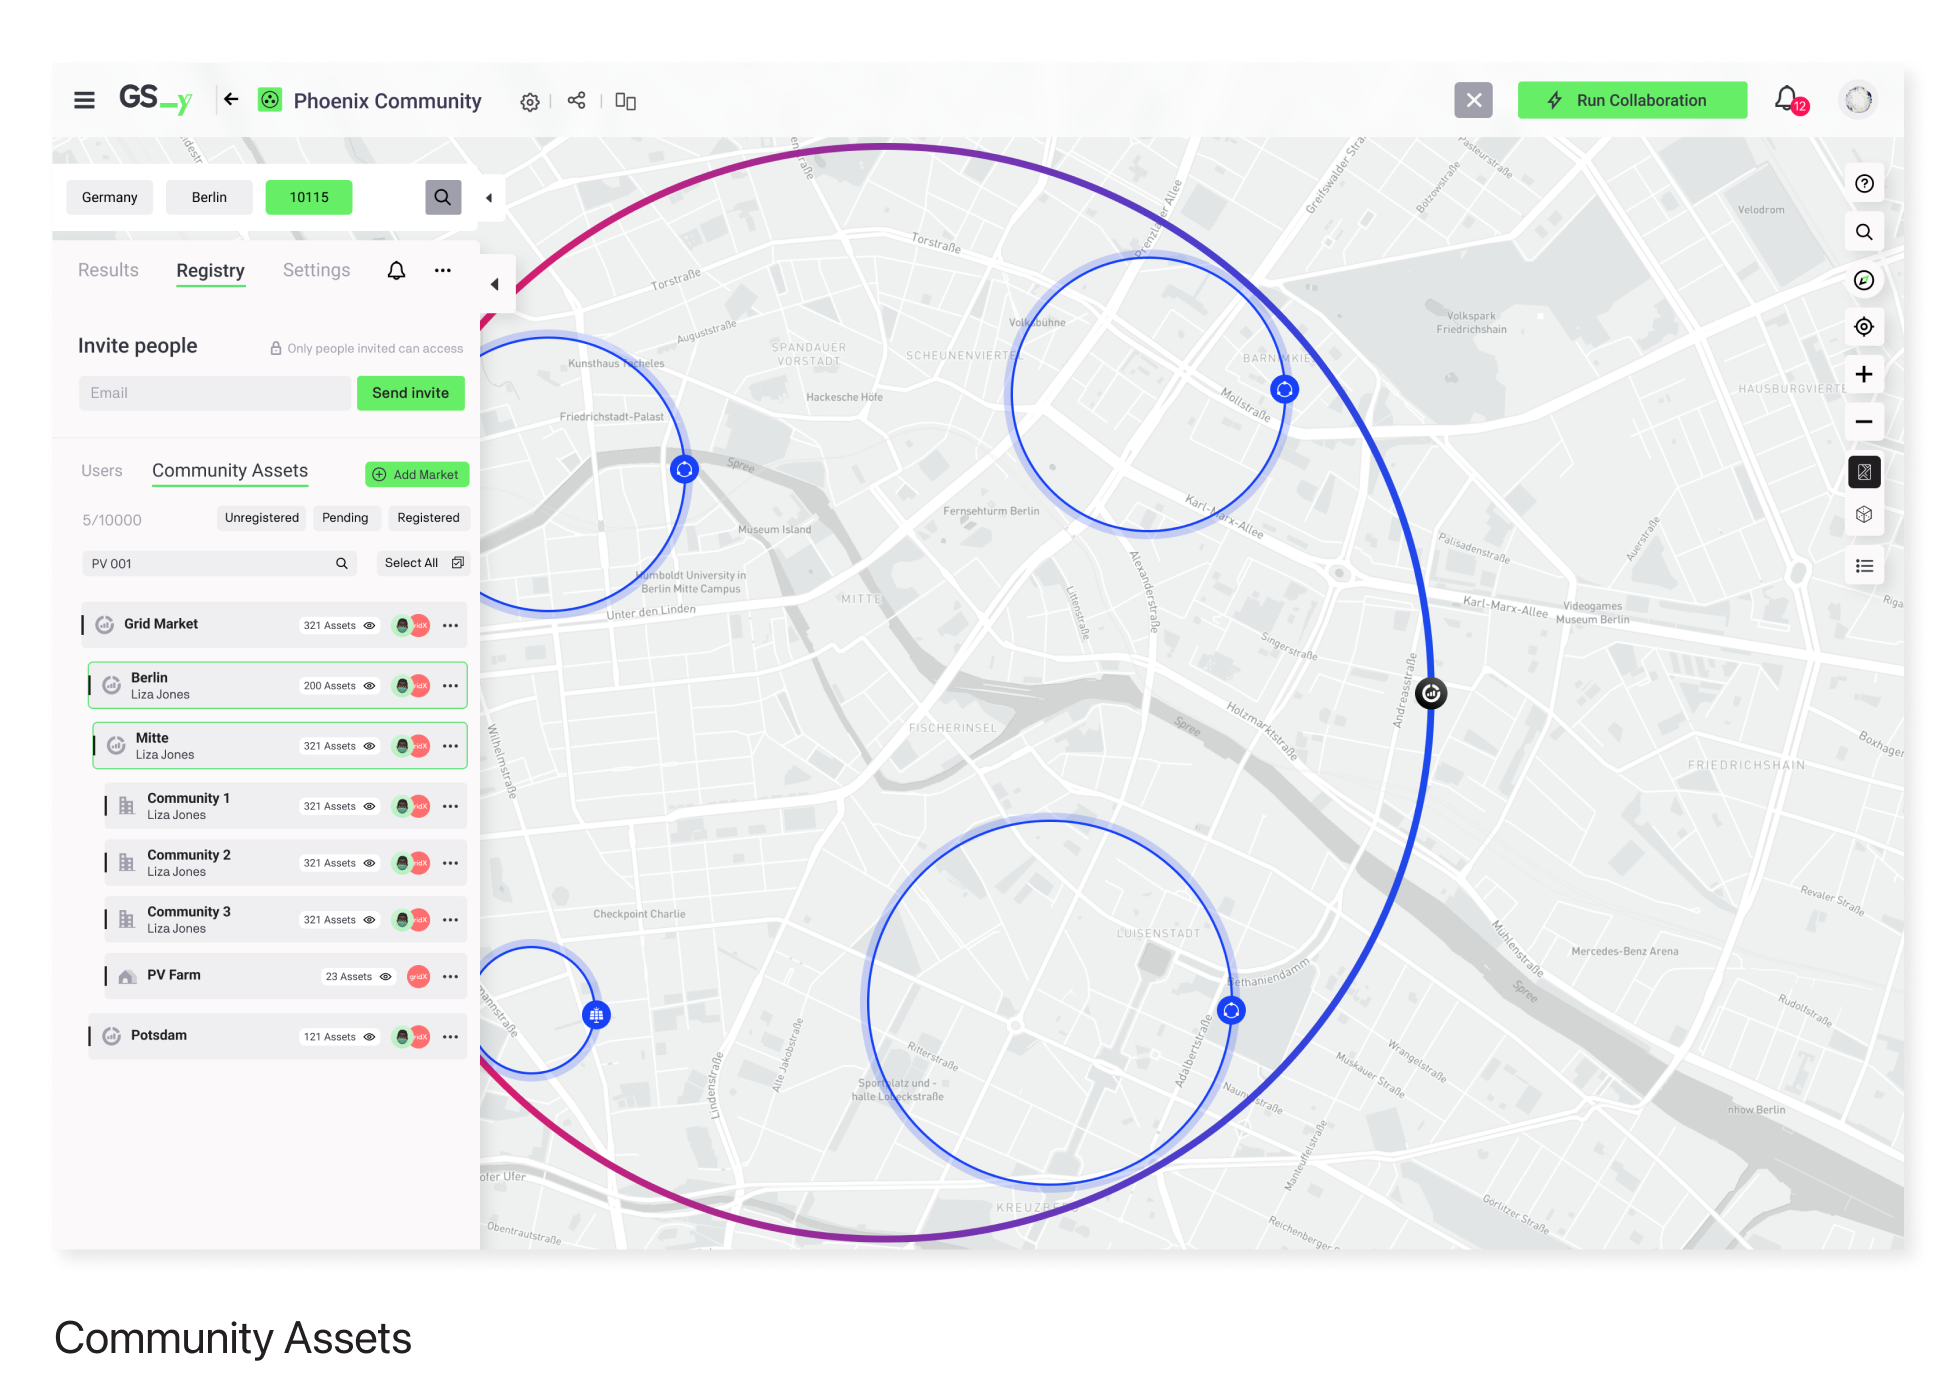
The map serves as the primary interface, allowing users to explore and create communities effortlessly. Users can create accounts in a few steps and start placing their houses on the map.
User stories were developed to guide the product's features, divided into pre-simulation and post-simulation states.
Pre-Simulation:
- Customize home and devices
- Select assets from a library or upload custom assets
Post-Simulation:
- Run simulations to obtain data for community management
Final Designs


Iteration and Improvement (Post-Launch)
Regular meetings with the Product Owner allowed us to gather user feedback and prioritize feature enhancements. We used a feature prioritization matrix to streamline decision-making and assigned features to designers for implementation.
Continuous iteration led to the development of features like the Help Center, addressing user needs and improving the overall experience.
Challenges
Before the launch, we conducted multiple usability testing sessions via Hangouts with real users to gather feedback. The main issues identified were:
- Hesitation in approaching the map
- Random clicking to guess the next step
- Misunderstanding of some icons
- Uncertainty about community creation
New Feature: Help Center
The ideation of this new feature was a consecuence of the user testing.
I took full ownership of designing the Help Center, from defining the user story and crafting the solution to supporting its implementation and delivery. This feature significantly enhanced the user experience.
Testing and Insights:
- We used Hotjar's Heatmap report to analyze user navigation patterns.
- Prototype testing with five users helped determine the optimal positioning and relevance of the Help Center content.

Dictionary: Brief description of the assets available for building communities in the map eg: Solar Panel, Default Community, etc.
Onboarding: Available onboardings will show up here. For now only one is developed: “Bild your community”
Tutorials: All relevant videos created for supporting the GSy users. The source of this videos comes from Youtube.
This approach, combining user feedback and data-driven insights, enabled us to fine-tune the Help Center, ensuring a seamless and intuitive user experience.